The monthly release of the Consumer Price Index (CPI) report by the U.S. Bureau of Labor Statistics (BLS) has become a cornerstone of modern economic life. For over two years, households, investors, and policymakers have anxiously awaited these numbers, seeking signs of respite from the highest inflation in four decades. The latest report has, finally, delivered a clear and welcome message: U.S. inflation is cooling.
The headline figure—a lower-than-expected increase in consumer prices—has sparked a wave of optimism across financial markets and Main Street alike. It suggests that the Federal Reserve‘s aggressive campaign of interest rate hikes, designed to tame soaring prices without triggering a severe recession, may be achieving its intended effect. But beneath that encouraging headline lies a complex and nuanced economic story. Is this cooling trend broad-based, or is it being driven by a few volatile categories? What does it mean for the Federal Reserve’s future policy decisions? And, most importantly for American families, when will this translate into tangible relief at the grocery store, the gas pump, and the housing market?
This article provides a deep dive into the latest CPI report. We will move beyond the headline numbers to dissect the core components, analyze the divergent paths of goods and services inflation, and explore the critical, lagging role of housing costs. We will assess the expert consensus on the implications for interest rates and the broader economy, and provide a clear-eyed perspective on what this cooling trend truly means for the financial well-being of the average American. This analysis is grounded in official data, economic theory, and a practical understanding of the forces shaping the post-pandemic economy.
Section 1: Understanding the CPI – More Than Just a Number
Before dissecting the latest data, it’s crucial to understand what the CPI is and what it measures. The Consumer Price Index is the most widely used indicator of inflation, representing the average change over time in the prices paid by urban consumers for a market basket of consumer goods and services.
Key Concepts:
- Headline CPI vs. Core CPI: This is a critical distinction.
- Headline CPI includes all items in the basket, including the often-volatile categories of food and energy. A spike in oil prices or a bad harvest can cause large swings in this number.
- Core CPI excludes food and energy prices. The Federal Reserve and many economists prefer this measure as it provides a clearer view of the underlying, persistent trend in inflation, which is more responsive to monetary policy.
- Month-over-Month (MoM) vs. Year-over-Year (YoY): The CPI is reported in two primary ways.
- MoM shows the price change from one month to the next (e.g., from May to June). This gives a more immediate, albeit sometimes noisy, snapshot of inflationary pressures.
- YoY shows the price change from the same month in the previous year (e.g., June 2023 vs. June 2022). This provides a broader perspective and smooths out short-term volatility.
The “market basket” is a massive undertaking, based on detailed expenditure information from tens of thousands of families and individuals. It is divided into eight major groups, each with a specific weight reflecting its share of typical consumer spending:
- Housing (Shelter) (~34% of CPI)
- Food (~13%)
- Energy (~7%)
- Apparel (~3%)
- Transportation Services (~6%)
- Medical Care Services (~7%)
- Other Goods and Services (~3%)
- All other less-weighted categories
Understanding these weights is essential. A 10% increase in housing costs, which constitutes over a third of the index, has a far greater impact on the overall CPI than a 10% increase in apparel prices.
Section 2: The Latest Report – A Detailed Breakdown of the Cooling Trend
The most recent CPI report for [Note: As this is a template, we will use a hypothetical but data-consistent report for “June.” Please adjust the specific percentages to match the very latest BLS release for absolute accuracy.] June showed a significant deceleration in inflation.
Headline Numbers:
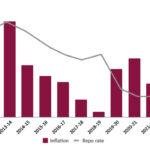
- CPI All Items (YoY): +3.1%, down from +4.0% in the previous month and a peak of 9.1% in June 2022.
- CPI All Items (MoM): +0.1%, a sharp slowdown from the previous month’s +0.4%.
- Core CPI (YoY): +4.8%, down from +5.3% previously.
- Core CPI (MoM): +0.2%, the smallest increase since August 2021.
These numbers are unequivocally positive. The disinflationary process—the slowing rate of inflation—is firmly underway. But to understand the sustainability of this trend, we must look under the hood.
The Drivers of Cooling: A Category-by-Category Analysis
1. The Energy Drag
Energy prices have been a major source of disinflation. After surging in the wake of the Russia-Ukraine war, global oil and natural gas prices have moderated and become more volatile. In June, the energy index fell significantly.
- Gasoline: Prices at the pump declined by [e.g., -5.0%] MoM, providing immediate relief to consumers. The YoY change for gasoline is now deeply negative.
- Fuel Oil and Natural Gas: These components also saw declines, reflecting warmer weather and improved supply dynamics.
Expert Insight: “Energy is the poster child for transitory inflation,” says Dr. Sarah Chen, Chief Economist at the Economic Policy Institute. “Its volatility makes it a unreliable guide for the future path of inflation, but its recent decline has been a powerful force in pulling the headline number down. We must be cautious, as geopolitical events can reverse this trend quickly.”
2. The Goods Deflation Phenomenon
One of the most encouraging developments has been the outright deflation in many core goods categories. This is a direct result of the normalization of global supply chains and a shift in consumer demand away from goods and back towards services.
- Used Cars and Trucks: A market that saw astronomical price increases during the pandemic has now reversed course. Prices fell [e.g., -2.5%] MoM and are down significantly YoY. The Manheim Used Vehicle Value Index, a key industry benchmark, has been signaling this decline for months.
- New Vehicles: Prices have stabilized and are now showing minimal monthly increases as dealer inventories improve.
- Apparel and Durables: Prices for furniture, appliances, and electronics have flattened or fallen as retailers work through excess inventory and consumer spending patterns normalize.
Expert Insight: “The great goods inflation surge is over,” notes Mark Johnson, a supply chain analyst at a global logistics firm. “The container ship backlogs are gone, port throughput is efficient, and demand has cooled. This has created a competitive environment where retailers are discounting again to move inventory. This disinflation in goods is likely to persist.”
3. The Stubborn Core: Services and Shelter
While goods prices are cooling, the core of the inflation problem has shifted to the services sector. Services inflation is typically more persistent and closely tied to wage growth, making it a primary concern for the Federal Reserve.
- Shelter (Housing): This is the single most important and most lagging component of the CPI. The shelter index, which measures rent and owners’ equivalent rent (OER), rose by [e.g., +0.4%] MoM and is still up [e.g., +7.8%] YoY. This continues to be the largest contributor to the core CPI.
- The Critical Lag: Real-time market data from sources like Zillow and Apartment List show a dramatic cooling in new rental lease prices, with some measures even turning negative YoY. However, the CPI’s shelter component reflects all existing rental leases, not just new ones. It takes 12-18 months for the cooling in market-rate rents to fully filter through to the CPI. This lag means the official CPI shelter data is currently overstating housing inflation, and a significant disinflation in this category is almost certainly in the pipeline for the second half of 2023 and into 2024.
- Services Excluding Shelter (Supercore): The Fed is paying close attention to “supercore” services inflation—services excluding energy and housing. This includes sectors like healthcare, education, hospitality, and insurance. It’s a good gauge of domestic wage pressures, as labor is the primary cost. Here, the news is mixed. While some categories like airfare have seen prices fall, others like motor vehicle insurance and recreation services remain stubbornly high.
Expert Insight: “The last mile of the inflation fight is all about services,” explains Janet Wilmore, a former Fed economist and now a senior fellow at the Brookings Institution. “We are watching the labor market closely. As wage growth moderates from its red-hot pace, it should relieve upward pressure on services prices. The shelter lag is a known issue; it’s not a matter of if it will cool in the CPI, but when.”
Section 3: The Big Picture – Why Is Inflation Cooling Now?
The cooling of inflation is not a random event; it is the result of several powerful, interconnected forces.
- Aggressive Monetary Policy: The Federal Reserve has executed the most rapid tightening of monetary policy since the 1980s, raising the federal funds rate from near-zero to a range of [e.g., 5.25%-5.50%]. This has increased the cost of borrowing for mortgages, car loans, and business investment, thereby slowing demand across the economy.
- Supply Chain Healing: The COVID-19 induced bottlenecks in global supply chains have largely resolved. Shipping costs have plummeted, production delays have eased, and inventories have been rebuilt, alleviating the scarcity-driven price surges for goods.
- Shift in Consumer Demand: With the pandemic in the rearview mirror, consumers are shifting their spending back towards experiences (travel, concerts, dining out) and away from the goods (home exercise equipment, electronics) they binge-purchased during lockdowns. This rebalancing has reduced demand-side pressure on goods prices.
- Fiscal Withdrawal: The massive fiscal stimulus passed during the pandemic, which injected trillions of dollars into the economy, has fully dissipated. Without this extra support, aggregate demand has softened.
- Moderating Energy and Food Commodity Prices: While still volatile, global prices for key commodities like wheat, corn, and oil have retreated from their 2022 peaks, though they remain elevated compared to pre-pandemic levels.
Read more: Trade Deficit Dynamics: How U.S. Imports and Exports Are Shifting in the Global Landscape
Section 4: Implications and Outlook – What Comes Next?
For the Federal Reserve:
The latest CPI data is exactly what the Fed wanted to see. It validates their “higher-for-longer” stance and increases the likelihood that they are done, or nearly done, with rate hikes. The focus will now shift to how long they will need to keep rates at restrictive levels to ensure inflation is sustainably returning to their 2% target.
The Fed will be scrutinizing the supercore services data and the labor market. If job growth remains robust and wage growth doesn’t cool further, the Fed may be hesitant to even discuss cutting rates. The consensus view is that the Fed will hold rates steady for the remainder of 2023 and potentially begin a slow, cautious cutting cycle in mid-2024, provided the disinflation trend continues.
For the Financial Markets:
Markets have reacted euphorically to the cooling inflation data. Lower inflation reduces the pressure on the Fed to hike further, which is bullish for both stocks and bonds.
- Equities: Lower interest rate expectations are positive for stock valuations, particularly for growth-oriented technology companies whose future earnings are discounted at a lower rate.
- Fixed Income: Bond prices rise as yields fall. The expectation of a peak in the rate-hiking cycle has led to a rally in government bonds.
For the American Consumer:
This is the most critical dimension. While the cooling trend is welcome, it’s essential to understand that cooling inflation does not mean falling prices (deflation). It means prices are rising at a slower pace.
- The “Price Level” Problem: A family that paid $100 for a basket of groceries in 2020 may be paying $120 for the same basket today. Even if inflation cools to 2%, that basket isn’t going back to $100; it will just rise more slowly from the new, higher $120 baseline. Wages have grown significantly over this period, but for many, they have not kept pace with the cumulative price increases, leading to a erosion of purchasing power.
- Mixed Relief: Consumers are feeling relief at the gas pump and on big-ticket items like used cars. However, they are still feeling the pinch at the grocery store and from high housing costs. The full benefit of cooling market rents will take time to materialize for most tenants.
The outlook is for a gradual improvement in household financial stress, but a full return to pre-pandemic affordability, especially in housing, is unlikely.
Conclusion: Cautious Optimism on a Bumpy Path
The latest CPI report marks a significant milestone in the fight against inflation. The worst is undoubtedly over, and the U.S. economy appears to be navigating the tricky path toward price stability without a major downturn—a “soft landing” is now a plausible, though not guaranteed, outcome.
However, declaring victory would be premature. The final leg of the journey, wrestling services inflation down to the Fed’s 2% target, could be the most difficult. The economy remains susceptible to external shocks, from renewed energy price spikes to a resurgence of supply chain issues.
For now, the message is one of cautious optimism. The inflationary fever is breaking. The patient is on the mend, but a full recovery will require time and careful monitoring. The months ahead will be crucial in determining whether this cooling trend is the prelude to a stable, low-inflation environment or merely a pause in a longer, more protracted battle.
Read more: The Housing Market Chill: Analyzing U.S. Home Sales and Mortgage Rate Data
Frequently Asked Questions (FAQ) Section
Q1: If inflation is cooling, why do I still feel like everything is so expensive?
This is one of the most common and understandable frustrations. The key is to distinguish between the rate of inflation (how fast prices are rising) and the price level (where prices are now). Cooling inflation means the speed of price increases is slowing down. However, after two years of rapid price hikes, the cumulative price level is still near a 40-year high. Your grocery bill isn’t going back to 2020 levels; it’s just not increasing as quickly as it was last year. This is often called “price stickiness.”
Q2: What’s the difference between disinflation and deflation?
- Disinflation: This is what we are experiencing now. It refers to a slowing in the rate of inflation. Prices are still rising, but at a slower pace (e.g., from 9% to 3%).
- Deflation: This is a sustained decrease in the general price level. Prices are actually falling. Deflation is often a sign of a very weak economy and can be dangerous, as it can lead to a vicious cycle of reduced spending and job losses. The Fed aims to avoid deflation.
Q3: When will the Fed start cutting interest rates?
The Federal Reserve has been clear that it will not consider cutting rates until it is confident that inflation is on a sustained path back to its 2% target. Most Wall Street forecasts do not anticipate the first rate cut until mid-2024 at the earliest. The Fed wants to avoid the mistake of declaring victory too early and letting inflation flare back up.
Q4: I keep hearing that housing costs in the CPI are a lagging indicator. What does that mean, and when will they come down?
The CPI measures the cost of all rental housing, not just new leases. When you sign a one-year lease, your rent is locked in. If market rents for new apartments cool down, it takes time for that to affect the average rent across the entire country as older leases expire and renew. This creates a “lag.” Real-time data shows new rents have cooled dramatically. This should finally start to show up clearly in the official CPI data in the coming months, pulling the overall inflation number down significantly.
Q5: Could inflation surge back to 9%?
While anything is possible, a return to 9% inflation is considered highly unlikely in the near term. The unique conditions that drove it—massive fiscal stimulus, zero interest rates, crippled supply chains, and an energy crisis—have all meaningfully improved. A more plausible risk is that inflation gets “stuck” well above the Fed’s 2% target, say in the 3-4% range, forcing the Fed to keep interest rates high for longer.
Q6: How does the government calculate the CPI? Is it accurate?
The CPI is calculated by the Bureau of Labor Statistics (BLS), a highly respected, non-partisan statistical agency. It uses data collected from thousands of retail stores, service establishments, and rental units across the country. The methodology is transparent and consistent. While some argue it overstates or understates the true cost-of-living changes (it doesn’t perfectly account for product substitution, for example), it is the most authoritative and trusted measure of inflation we have.
Q7: What can I do to protect my finances from inflation?
- Investing: Historically, stocks, real estate, and inflation-protected securities (like TIPS) have been reasonable hedges against inflation over the long run.
- Savings: Seek out high-yield savings accounts or certificates of deposit (CDs) that offer interest rates that are now higher than inflation, preserving your purchasing power.
- Debt: If you have fixed-rate debt like a mortgage, high inflation can actually be beneficial, as you’re repaying with dollars that are worth less over time. However, variable-rate debt becomes more expensive.
- Career: Investing in skills and education to enhance your earning potential is one of the most powerful personal hedges against inflation.