The American consumer is the undisputed engine of the U.S. economy, accounting for approximately two-thirds of the nation’s Gross Domestic Product (GDP). This makes the behavior of this collective entity—what we buy, when we buy it, and how much we spend—a subject of intense scrutiny for economists, policymakers, investors, and business leaders alike. At the heart of understanding this behavior lie two critical, interconnected indicators: Consumer Sentiment and Retail Sales Data.
One measures the psychological pulse of the nation—how people feel about their financial present and future. The other provides a hard, quantitative record of their actual economic actions—the dollars spent at cash registers and online checkouts. The relationship between these two indicators is not always straightforward. It is a complex, often nuanced dance between perception and reality, confidence and caution, aspiration and necessity.
This article will provide a deep dive into both consumer sentiment and retail sales data. We will explore how they are measured, what drives them, and, most importantly, how to interpret the dynamic and sometimes contradictory relationship between them. By understanding this interplay, we can gain a clearer picture of the overall health of the economy and its potential future trajectory.
Part 1: The Pulse of the Nation – Understanding Consumer Sentiment
Consumer sentiment, often called consumer confidence, is a statistical measure of the overall health of the economy as perceived by individual consumers. It is a forward-looking indicator, reflecting how optimistic or pessimistic people are about their own financial situation and the broader economy’s prospects in the near future.
Key Measures of Consumer Sentiment
In the United States, two primary surveys are the gold standard for tracking consumer sentiment:
- The University of Michigan Surveys of Consumers: This is one of the longest-running and most respected measures. Each month, the Survey Research Center at the University of Michigan interviews a representative sample of U.S. households. The core questions focus on:
- Current Personal Financial Situation: Compared with a year ago, are you better or worse off financially?
- Expected Personal Financial Situation: A year from now, do you expect to be better or worse off financially?
- Short-Term Business Conditions: Do you expect businesses in the U.S. to have good or bad times over the next 12 months?
- Long-Term Business Conditions: And what about the next five years?
- Buying Conditions for Major Household Items: Is it a good or bad time to buy large items like cars, appliances, or furniture?
- The Conference Board Consumer Confidence Index®: This is another highly influential monthly survey. It similarly asks respondents to assess current business and labor market conditions and their expectations for the next six months. The Conference Board’s index places a slightly heavier emphasis on the labor market—questions about job availability and expectations are central. It also includes a “Plans to Buy” component, which tracks intentions to purchase homes, cars, and major appliances.
What Drives Consumer Sentiment?
Sentiment is not formed in a vacuum. It is a reactive indicator, shaped by a multitude of factors:
- The Labor Market: This is arguably the most powerful driver. Low unemployment, rising wages, and a sense of job security breed high confidence. Conversely, news of layoffs, hiring freezes, or economic slowdowns can cause sentiment to plummet.
- Inflation: The pace of rising prices directly impacts purchasing power. When inflation is high, especially for essentials like food, energy, and housing, consumers feel a pinch on their wallets, leading to pessimism. The perception of future inflation can be just as damaging as the current reality.
- Stock Market and Housing Market Performance: For the segment of the population invested in these markets, significant gains create a “wealth effect,” making people feel more prosperous and inclined to spend. Sharp declines can have the opposite effect, even if their immediate income is unchanged.
- Government Policy and Political Climate: Tax cuts, stimulus checks, and changes in interest rates by the Federal Reserve can directly influence sentiment. Furthermore, the general political environment and media narratives can shape collective optimism or pessimism, often along partisan lines.
- Global Events: Geopolitical crises, international trade disputes, and global pandemics (as vividly demonstrated in 2020) can create widespread uncertainty and fear, causing sentiment to drop sharply.
Part 2: The Hard Numbers – Decoding U.S. Retail Sales Data
While sentiment captures the “mood,” retail sales data captures the “motion.” It is a concrete measure of the total receipts at stores that sell merchandise directly to consumers.
The Source: The U.S. Census Bureau’s Monthly Retail Trade Survey
The definitive source for U.S. retail sales data is the Advance Monthly Retail Trade and Food Services Survey conducted by the U.S. Census Bureau. This survey provides an early estimate of retail and food service sales for the previous month, typically released around the 15th.
Key Characteristics of the Report:
- It’s an “Advance” Estimate: The first release is based on a subsample of respondents and is subject to revision in the subsequent two months as more complete data comes in.
- It’s Nominal (Not Adjusted for Inflation): The headline number represents total dollar sales. This is crucial to remember, as an increase in sales could be driven by higher prices (inflation) rather than an increase in the volume of goods sold.
- It’s Seasonally Adjusted: The data is adjusted to account for predictable seasonal patterns, such as the holiday shopping surge in December or the lull in January, allowing for meaningful month-to-month comparisons.
- It’s Categorized: The report breaks down sales into numerous categories, providing granular insights into where consumer spending is strong or weak.
Key Categories in the Retail Sales Report:
Analyzing the category-level data is where the real story emerges.
- Motor Vehicle & Parts Dealers: A highly volatile category that can significantly sway the headline number.
- Building Materials & Garden Equipment: Often a proxy for the health of the housing market and homeowner confidence.
- Gasoline Stations: Sales here are heavily influenced by gas prices rather than volume. A spike in gas prices can inflate the headline retail sales number, which can be misleading.
- Food & Beverage Stores and Food Services & Drinking Places: These represent spending on necessities (groceries) and discretionary services (restaurants, bars). Strong restaurant sales often indicate consumer confidence, as eating out is an easy expense to cut when times are tight.
- Nonstore Retailers: This is the category for e-commerce, including online giants and small web-based businesses. Its consistent long-term growth is a defining trend of the 21st century.
- General Merchandise Stores: Includes department stores and warehouse clubs.
- Clothing & Accessory Stores: A highly discretionary category sensitive to economic cycles.
- Furniture, Electronics, & Appliance Stores: These represent big-ticket, durable goods purchases that consumers often finance. Weakness here can signal concerns about future debt burdens.
Part 3: The Intricate Dance – How Sentiment and Spending Interact
This is the core of the analysis. The relationship between how consumers feel and how they spend is not a simple, mechanical one. It is a dynamic interplay that can reveal much about the underlying economic environment.
Scenario 1: Alignment – High Sentiment and Strong Spending (The “Goldilocks” Economy)
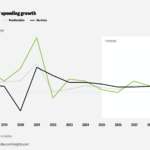
This is the most intuitive scenario. When unemployment is low, wages are growing, and inflation is stable, consumers feel confident. This optimism translates directly into robust spending, particularly on discretionary and big-ticket items. Businesses see strong demand, invest in expansion, and hire more workers, creating a virtuous cycle of economic growth. The periods of the mid-to-late 1990s and the mid-2010s are classic examples of this alignment.
Scenario 2: Alignment – Low Sentiment and Weak Spending (The Recessionary Spiral)
The inverse is also clear. During an economic downturn or crisis, layoffs rise, wages stagnate, and fear takes hold. Sentiment plummets. In response, consumers tighten their belts, defer major purchases, and focus spending only on essentials. This contraction in consumer demand hurts business revenues, leading to more layoffs and cutbacks, deepening the recession. The 2008 Financial Crisis and the initial months of the COVID-19 pandemic are stark illustrations of this dynamic.
Scenario 3: The Divergence – Strong Spending Despite Low Sentiment (The “Vibecession”)
This is the most perplexing and analytically challenging scenario, and it has been particularly prevalent in the post-2021 economic landscape. How can retail sales remain resilient or even grow while consumer sentiment languishes near recessionary lows?
This phenomenon, sometimes dubbed the “vibecession,” can be explained by several powerful, competing forces:
- The Power of a Strong Labor Market: Even if people are unhappy about high prices, if they have a job and are receiving steady paychecks, they have the means to spend. The U.S. labor market post-2021 remained remarkably tight, with low unemployment and solid wage growth. This provided a financial floor for spending, even as sentiment was battered by inflation.
- Pandemic-Era Savings and Fiscal Stimulus: During the pandemic, government stimulus payments, coupled with reduced spending on services like travel and dining, led to a historic accumulation of excess household savings. This stockpile allowed many consumers to maintain their spending levels for a time, even as their real wages were eroded by inflation.
- The “Forced” Spending of Inflation: A key mechanical reason for strong nominal retail sales is inflation itself. If the price of a gallon of milk or a tank of gas doubles, the dollar value of retail sales will rise, even if the consumer is buying the exact same quantity. This creates a statistical illusion of health while the consumer’s lived experience is one of financial stress.
- Composition of Spenders: The aggregate data can mask demographic shifts. While lower-income households, who feel the brunt of inflation most acutely, may be cutting back, higher-income households with more disposable income and assets may continue to spend freely on travel, luxury goods, and experiences, propping up the overall numbers.
- Shifting Spending Patterns (The “Substitution Effect”): Consumers don’t stop spending; they change what they spend on. They may cut back on goods (e.g., buying fewer new clothes) but increase spending on services like concerts and vacations (“revenge travel”). They may trade down from name brands to private labels at the grocery store. This reshuffling can keep overall sales figures stable while reflecting underlying consumer strain.
Scenario 4: The Divergence – Weak Spending Despite High Sentiment
This is a rarer but possible scenario. It could occur if a positive sentiment survey is captured just before a sudden, negative economic shock (e.g., a geopolitical event). It could also happen if credit becomes very expensive or difficult to obtain (tightening lending standards), preventing confident consumers from acting on their intentions to make large, credit-funded purchases.
Part 4: A Case Study in Complexity – The Post-Pandemic Economy (2021-2024)
The period following the height of the COVID-19 pandemic serves as a master class in the complex relationship between sentiment and spending.
- 2021: The Great Reopening Boom. Sentiment and spending were broadly aligned—both surged. Pent-up demand, massive fiscal stimulus, and reopening optimism led to a historic spike in retail sales as consumers spent on goods for their homes and then, increasingly, on services.
- 2022-2023: The “Vibecession” Takes Hold. As inflation soared to 40-year highs, driven by supply chain disruptions, energy shocks from the war in Ukraine, and strong demand, consumer sentiment cratered. By mid-2022, the University of Michigan’s Index of Consumer Sentiment had hit its lowest level on record. Yet, retail sales remained surprisingly resilient. This was the great divergence in action, explained by the factors above: a strong job market, residual savings, and the inflationary boost to nominal sales figures.
- 2024 and Beyond: The “Normalization”? As inflation began to cool significantly through 2023 and into 2024, and the labor market remained strong but moderated, a fascinating development occurred: consumer sentiment began a sharp, sustained recovery. By the first half of 2024, the Michigan index had recovered nearly all of its post-pandemic losses. This suggested that the long-awaited alignment between improving perceptions and spending was finally happening. However, new questions emerged about the durability of spending as pandemic savings were depleted and higher interest rates made credit card and auto loan debt more expensive to service.
Read more: US weighs annual China chip supply approvals for Samsung, Hynix
Part 5: Why This Matters – Implications for Stakeholders
Understanding the nuances of these indicators is not an academic exercise. It has real-world consequences.
- For Investors and Financial Analysts: Retail sales data is a key input for forecasting corporate earnings. Strong sales in a specific sector (e.g., e-commerce or travel) can signal investment opportunities. Divergences can create market volatility as participants debate whether to trust the “hard data” (spending) or the “soft data” (sentiment).
- For the Federal Reserve: The Fed is tasked with managing inflation and maximizing employment. Strong retail sales, if driven by robust demand, can signal an overheating economy and argue for tighter monetary policy (higher interest rates). However, if strong sales are merely a function of inflation, the Fed’s job becomes more complex. They rely on both indicators to gauge the underlying strength of the economy.
- For Business Leaders and Retailers: A CEO uses these indicators for strategic planning. Low sentiment might prompt a retailer to be more cautious with inventory orders. Understanding category-level shifts (e.g., from goods to services) is essential for allocating capital and marketing resources effectively.
- For Policymakers: Congress and the White House use this data to assess the impact of fiscal policies. Weak sentiment and spending could be used to argue for stimulus measures, while strong data could support a focus on deficit reduction.
Conclusion: Two Sides of the Same Coin
Consumer sentiment and retail sales data are not rivals; they are two complementary lenses through which to view the health of the American consumer. Sentiment offers a psychological X-ray, revealing the fears, hopes, and expectations that drive economic decision-making. Retail sales provide the hard evidence of what consumers actually did.
While we naturally look for a clean, correlated story between how people feel and how they spend, the reality is often messier and more interesting. Divergences are not failures of the data but revelations of deeper economic undercurrents—the tension between a strong job market and painful inflation, or the lag between improving conditions and public perception.
For anyone seeking to truly understand the U.S. economy, it is essential to look at both indicators together, to listen to both the words and the actions of the consumer. They are, and will remain, the dual heartbeat of the nation’s economic life.
Read more: The Relationship Between Inflation, Interest Rates, and Consumer Spending
Frequently Asked Questions (FAQ)
Q1: Which is a more reliable predictor of a recession: consumer sentiment or retail sales?
Historically, a sharp, sustained decline in consumer sentiment has been a more reliable leading indicator of a recession. This is because it captures the fear and precautionary behavior that often precedes a actual pullback in spending. Retail sales are more of a coincident indicator—they tell you what is happening right now. However, a significant drop in retail sales, especially for big-ticket items, can confirm that a downturn is underway.
Q2: Why does the stock market sometimes fall on “good” retail sales news?
This is a classic case of “bad news is good news” in certain market environments, particularly when the Federal Reserve is raising interest rates to combat inflation. Strong retail sales data can be interpreted by Wall Street as a sign that the economy is still running too hot, which could force the Fed to keep interest rates higher for longer. Higher interest rates are generally negative for stock valuations, as they increase borrowing costs for companies and make bonds a more attractive investment relative to stocks.
Q3: What is the difference between “real” and “nominal” retail sales, and why does it matter?
- Nominal Retail Sales: The headline number reported by the Census Bureau. It is the total dollar value of sales, not adjusted for inflation.
- Real Retail Sales: The nominal sales figure adjusted for inflation (using a price index like the Consumer Price Index).
This distinction is critical. If nominal sales are up 5% in a year, but inflation was 6%, it means the volume of goods and services actually purchased declined by about 1%. Real retail sales give a much clearer picture of the true health of consumer demand.
Q4: How has the rise of e-commerce changed the interpretation of retail sales data?
E-commerce has fundamentally reshaped the retail landscape. The “Nonstore Retailers” category has been the fastest-growing segment for years. This means analysts must look beyond traditional brick-and-mortar categories. It also creates challenges in direct year-over-year comparisons, as a dollar spent online is often substituting for a dollar that would have been spent in a physical store. Furthermore, the ease and convenience of online shopping may have altered the relationship between sentiment and spending, making impulse purchases easier.
Q5: My personal spending doesn’t always match the national data. Why is that?
This is a very common observation. Retail sales data is a macroeconomic aggregate—it’s the sum of hundreds of millions of individual transactions. Your personal experience is a single data point within that massive dataset. The aggregate number can be pulled up by spending from high-income households or in specific regions, even if many individuals are feeling squeezed. Furthermore, the data includes both necessities (which you can’t easily cut) and discretionary items (which you can), and the balance between these varies greatly from person to person.
Q6: Where can I find the official retail sales and consumer sentiment data?
- Retail Sales: The U.S. Census Bureau’s website publishes the “Advance Monthly Sales for Retail and Food Services” report.
- University of Michigan Sentiment: The University of Michigan’s Survey of Consumers website releases its data.
- Conference Board Confidence: The Conference Board’s website publishes its Consumer Confidence Index®.